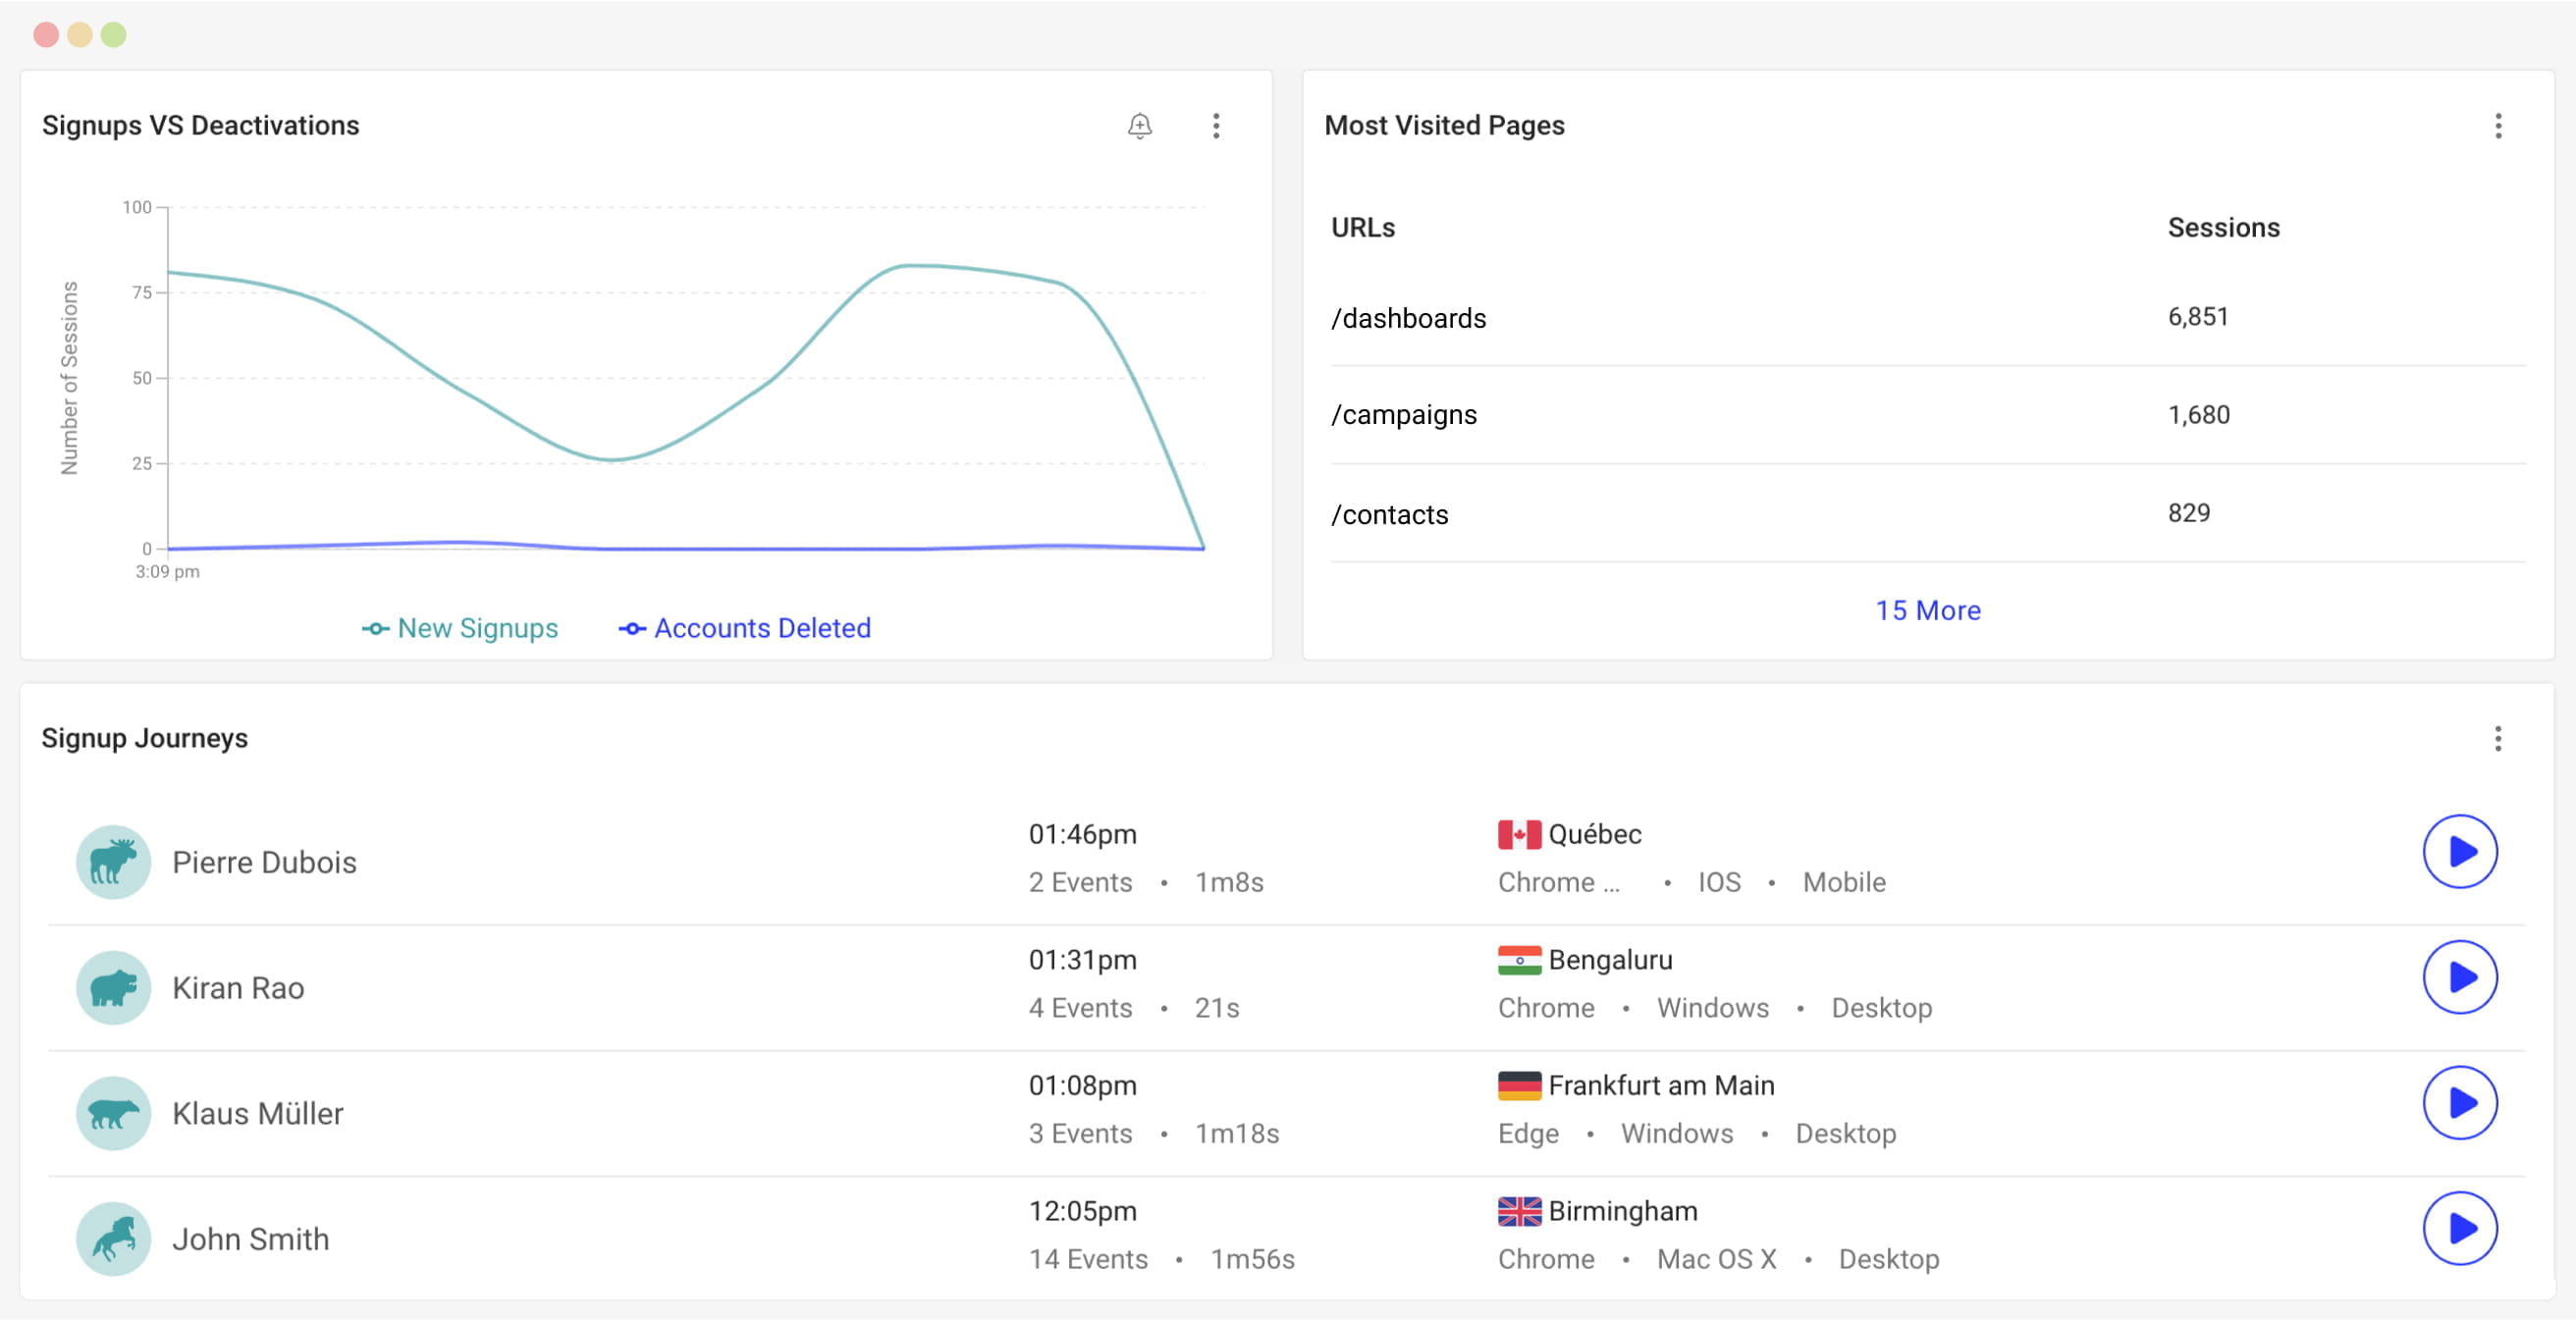
Performance Monitoring
Gain insight into frontend performance and its impact on user experience with data, charts, and dashboards.
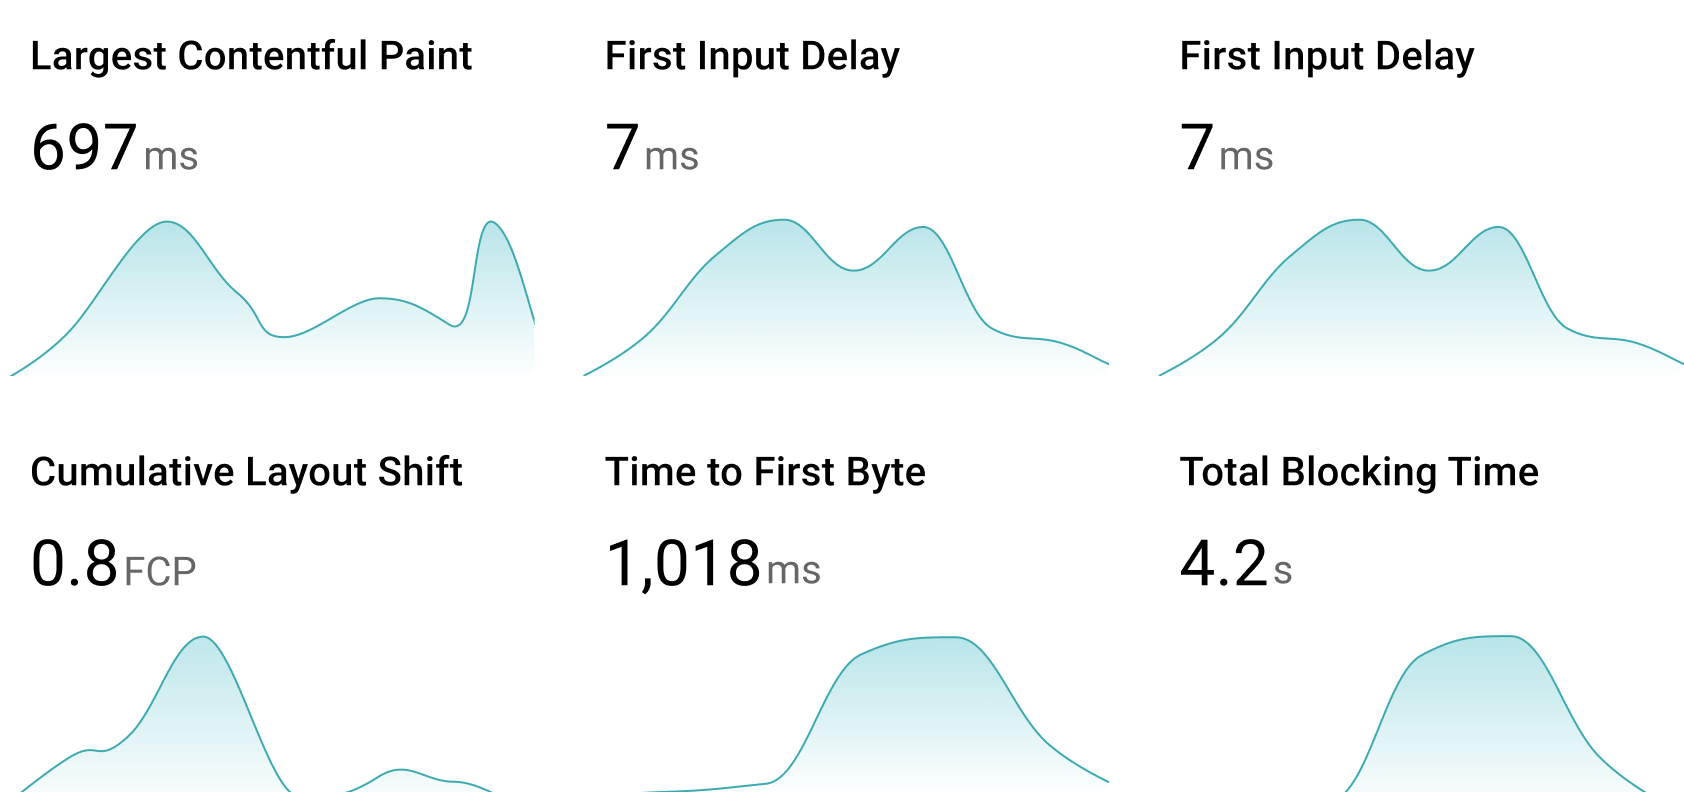

Web Vitals
Track core web vital metrics at the session or aggregate level to measure the performance and user experience of your apps.
- Largest Contentful Paint (LCP) and First Input Delay (FID)
- DOM completion and Cumulative layout shift (CLS)
- Time to first byte (TTFB) and Crashes
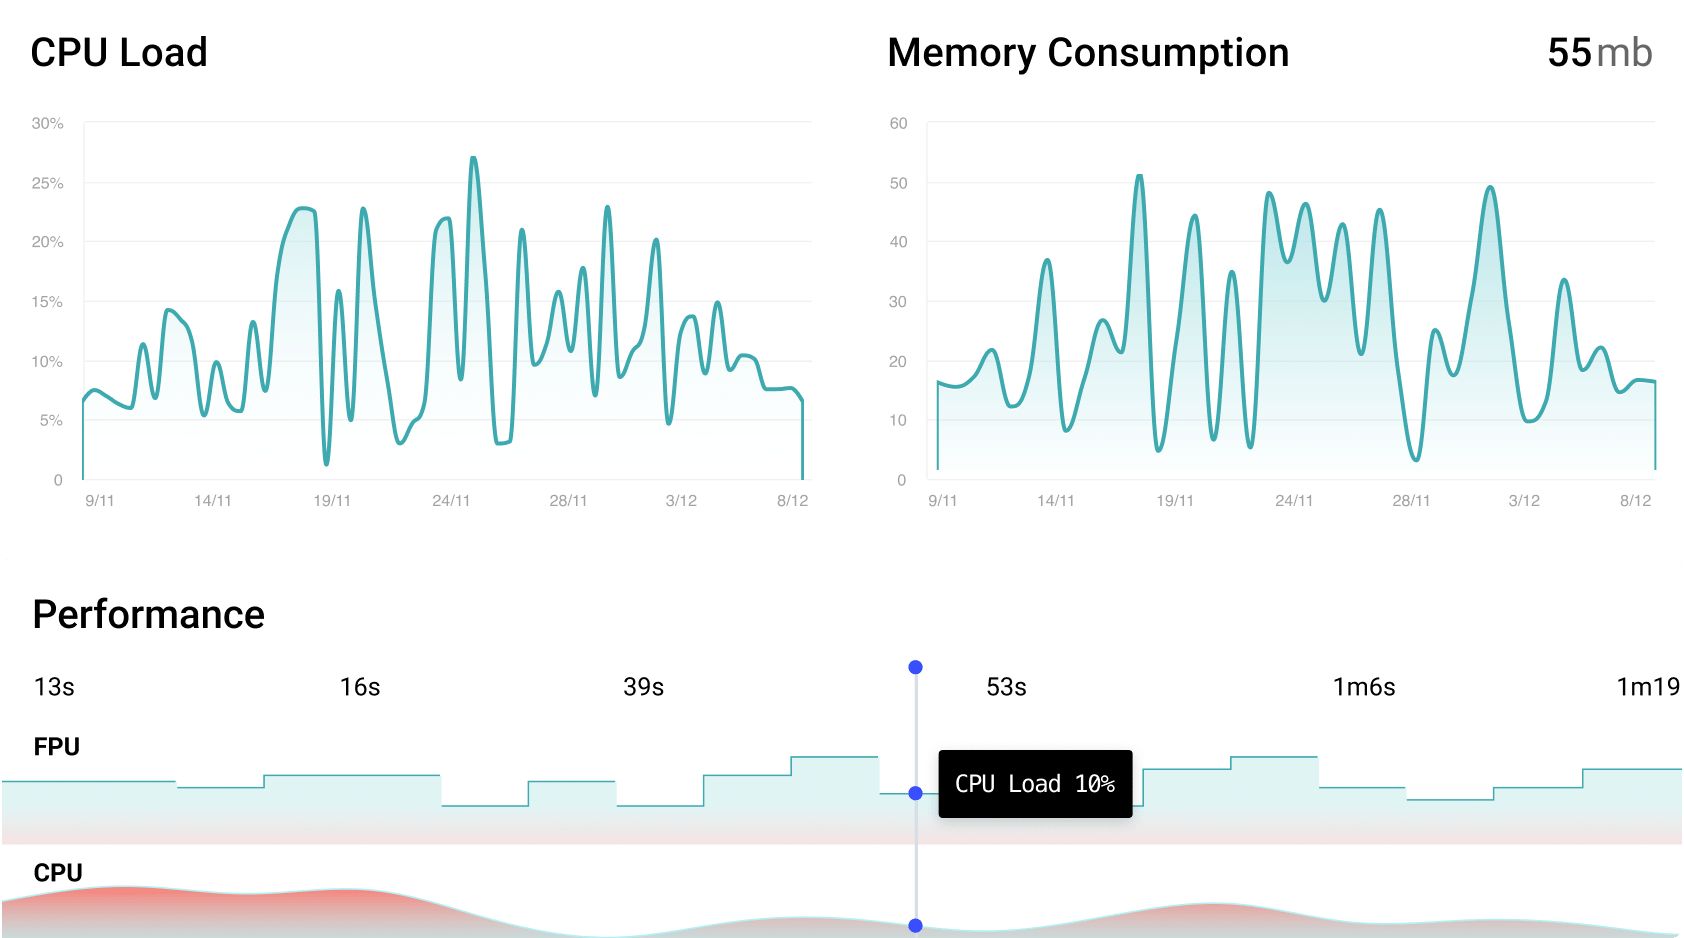
CPU and Memory Utilization
Identify and investigate CPU and memory usage spikes, and their impact on user experience. Drill down into specific sessions to find the root cause of memory leaks or spikes.


Network Performance: Request Duration, and Page Load
Understand how network latency influences app responsiveness and user experience. Tune your app to improve UX and boost performance indicators.

Alerting
Take proactive steps to address issues by setting up alerts based on threshold breaches or metric change.

Ready to start?
Create an account instantly, and supercharge your stack.
Get started with a free plan on our Cloud OR self-host our community edition on your premises.
Get started with a free plan on our Cloud OR self-host our community edition on your premises.
Self-Host
Follow our step-by-step guides to deploy OpenReplay on your infrastructure.
OpenReplay Cloud
This is the hosted version of our open-source project. We’ll manage hosting, scaling and upgrades.

Unlock the Power of Session Replay
Understand what session replay is, how it helps, and why it matters for developers, product managers, designers, and customer support teams.